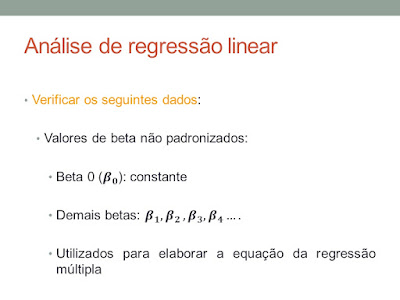
Para fazer análise de regressão linear:
Primeiro fazer um teste de correlação:
Se a distribuição for normal utilizar correlação de Pearson,
se não for normal usar Spearman.
|
Correlations
|
||||||
|
|
|
VO2
|
Idade
|
IMC
|
Distância
|
Velocidade da Marcha
|
|
VO2
|
Pearson
Correlation
|
1
|
,396*
|
-,302
|
,654**
|
,689**
|
|
Sig.
(2-tailed)
|
|
,045
|
,133
|
,000
|
,000
|
|
|
N
|
26
|
26
|
26
|
26
|
25
|
|
|
Idade
|
Pearson
Correlation
|
,396*
|
1
|
,109
|
,622**
|
,508**
|
|
Sig.
(2-tailed)
|
,045
|
|
,596
|
,001
|
,009
|
|
|
N
|
26
|
26
|
26
|
26
|
25
|
|
|
IMC
|
Pearson
Correlation
|
-,302
|
,109
|
1
|
,165
|
,031
|
|
Sig.
(2-tailed)
|
,133
|
,596
|
|
,420
|
,884
|
|
|
N
|
26
|
26
|
26
|
26
|
25
|
|
|
Distância
|
Pearson
Correlation
|
,654**
|
,622**
|
,165
|
1
|
,877**
|
|
Sig.
(2-tailed)
|
,000
|
,001
|
,420
|
|
,000
|
|
|
N
|
26
|
26
|
26
|
26
|
25
|
|
|
Velocidade
da Marcha
|
Pearson
Correlation
|
,689**
|
,508**
|
,031
|
,877**
|
1
|
|
Sig.
(2-tailed)
|
,000
|
,009
|
,884
|
,000
|
|
|
|
N
|
25
|
25
|
25
|
25
|
25
|
|
|
*. Correlation is significant at the
0.05 level (2-tailed).
|
||||||
|
**. Correlation is significant at the 0.01 level
(2-tailed).
|
||||||
As variáveis que apresentaram valor de p < 0,20 são
escolhidas para o modelo de regressão linear simples.
Para fazer o modelo de regressão linear simples:
Primeiro deve ser analisada uma variável de cada vez.
Ex: VO2 variável dependente
Idade variável
independente
*Método Stepwise
Só permanecerão no modelo de regressão linear múltipla
aquelas variáveis que apresentarem valor de p < 0,05.
Permaneceram no modelo as variáveis idade, velocidade e
distância.
A partir daí iremos montar o modelo de regressão múltipla.
Entrar no quadrinho Statistics e marcar tudo.
Entrar no quadrinho Plots:
|
Variables Entered/Removeda
|
|||
|
Model
|
Variables Entered
|
Variables Removed
|
Method
|
|
1
|
Velocidade
da Marcha
|
.
|
Stepwise (Criteria:
Probability-of-F-to-enter <= ,050, Probability-of-F-to-remove >=
,100).
|
|
a.
Dependent Variable: VO2
|
|||
|
Model Summaryb
|
||||||||||||||||||||||||||||||||||||||||||||||||||||||||||||||||||||||||||||||||||||||||||||||||||||||||||||||||||||||||||||||||||||||||||||||||||||||||||||||||||||||||||||||||||
|
Model
|
R
|
R Square
|
Adjusted R Square
|
Std. Error of the Estimate
|
Change Statistics
|
Durbin-Watson
|
||||||||||||||||||||||||||||||||||||||||||||||||||||||||||||||||||||||||||||||||||||||||||||||||||||||||||||||||||||||||||||||||||||||||||||||||||||||||||||||||||||||||||||
|
R Square Change
|
F Change
|
df1
|
df2
|
Sig. F Change
|
||||||||||||||||||||||||||||||||||||||||||||||||||||||||||||||||||||||||||||||||||||||||||||||||||||||||||||||||||||||||||||||||||||||||||||||||||||||||||||||||||||||||||||||
|
1
|
,689a
|
,475
|
,452
|
6,05288
|
,475
|
20,796
|
1
|
23
|
,000
|
1,947
|
||||||||||||||||||||||||||||||||||||||||||||||||||||||||||||||||||||||||||||||||||||||||||||||||||||||||||||||||||||||||||||||||||||||||||||||||||||||||||||||||||||||||
|
a.
Predictors: (Constant), Velocidade da Marcha
|
||||||||||||||||||||||||||||||||||||||||||||||||||||||||||||||||||||||||||||||||||||||||||||||||||||||||||||||||||||||||||||||||||||||||||||||||||||||||||||||||||||||||||||||||||
|
b.
Dependent Variable: VO2
|
||||||||||||||||||||||||||||||||||||||||||||||||||||||||||||||||||||||||||||||||||||||||||||||||||||||||||||||||||||||||||||||||||||||||||||||||||||||||||||||||||||||||||||||||||


Nenhum comentário:
Postar um comentário